.png?width=200&height=200&name=dovetail%20workmarklogo%20(1).png)

This is the first in a short series exploring useful HTML experiences you can create with Copilot beyond SharePoint Lists and Libraries. We’re starting with Excel: how to turn a workbook into a live dashboard that can retrieve the latest saved data from SharePoint.
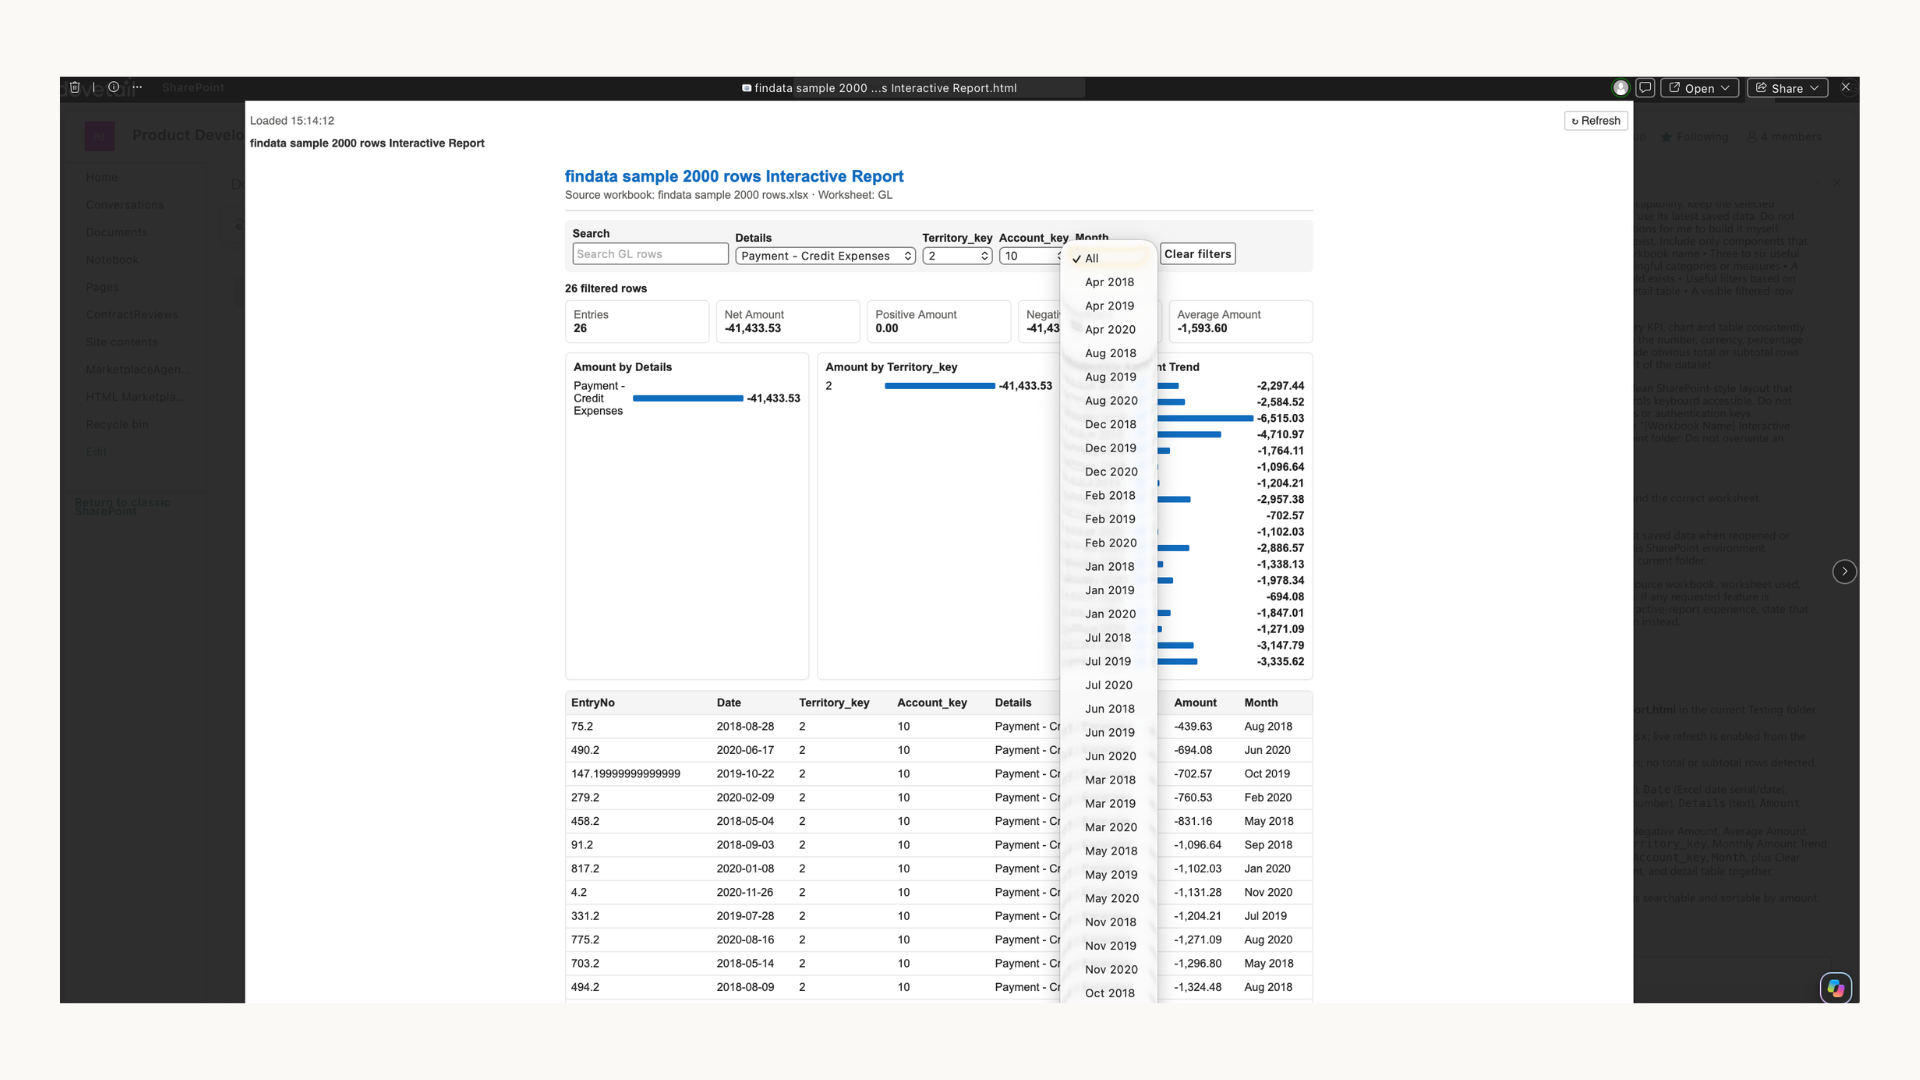
Copilot can turn a well-structured Excel workbook into an interactive HTML dashboard, complete with headline figures, charts, filters and a table of the underlying data.
However, a dashboard created from an uploaded workbook will usually represent the data at the point it was generated. If the Excel data changes, the dashboard may need to be recreated.
In this guide, we’ll use Copilot in SharePoint to create a dashboard that keeps the selected workbook as its source. When the workbook is edited and saved, selecting Refresh should retrieve the latest data and update the dashboard without rebuilding it from scratch. Because availability and behaviour can vary by tenant, permissions and rollout stage, test the connection in your own environment before relying on it.
We’ll cover how to create the dashboard, check the figures and prove that it is retrieving changes from the workbook.
Before you start
You’ll need:
- An Excel workbook stored in a SharePoint document library
- Clear column headings and consistently structured rows
- Access to Copilot in SharePoint
- Permission to view and edit the workbook
- A clear idea of who will use the dashboard and what they need to understand
Before continuing, remove unnecessary blank rows, check that dates and numbers are stored consistently, and make sure each row represents the same type of record.
For your first test, use a simple workbook without sensitive or confidential information. Copilot availability may vary depending on your Microsoft 365 licence, permissions and tenant configuration.
Create the live dashboard
Step 1: Select the workbook in SharePoint
Open the SharePoint document library containing your Excel workbook.
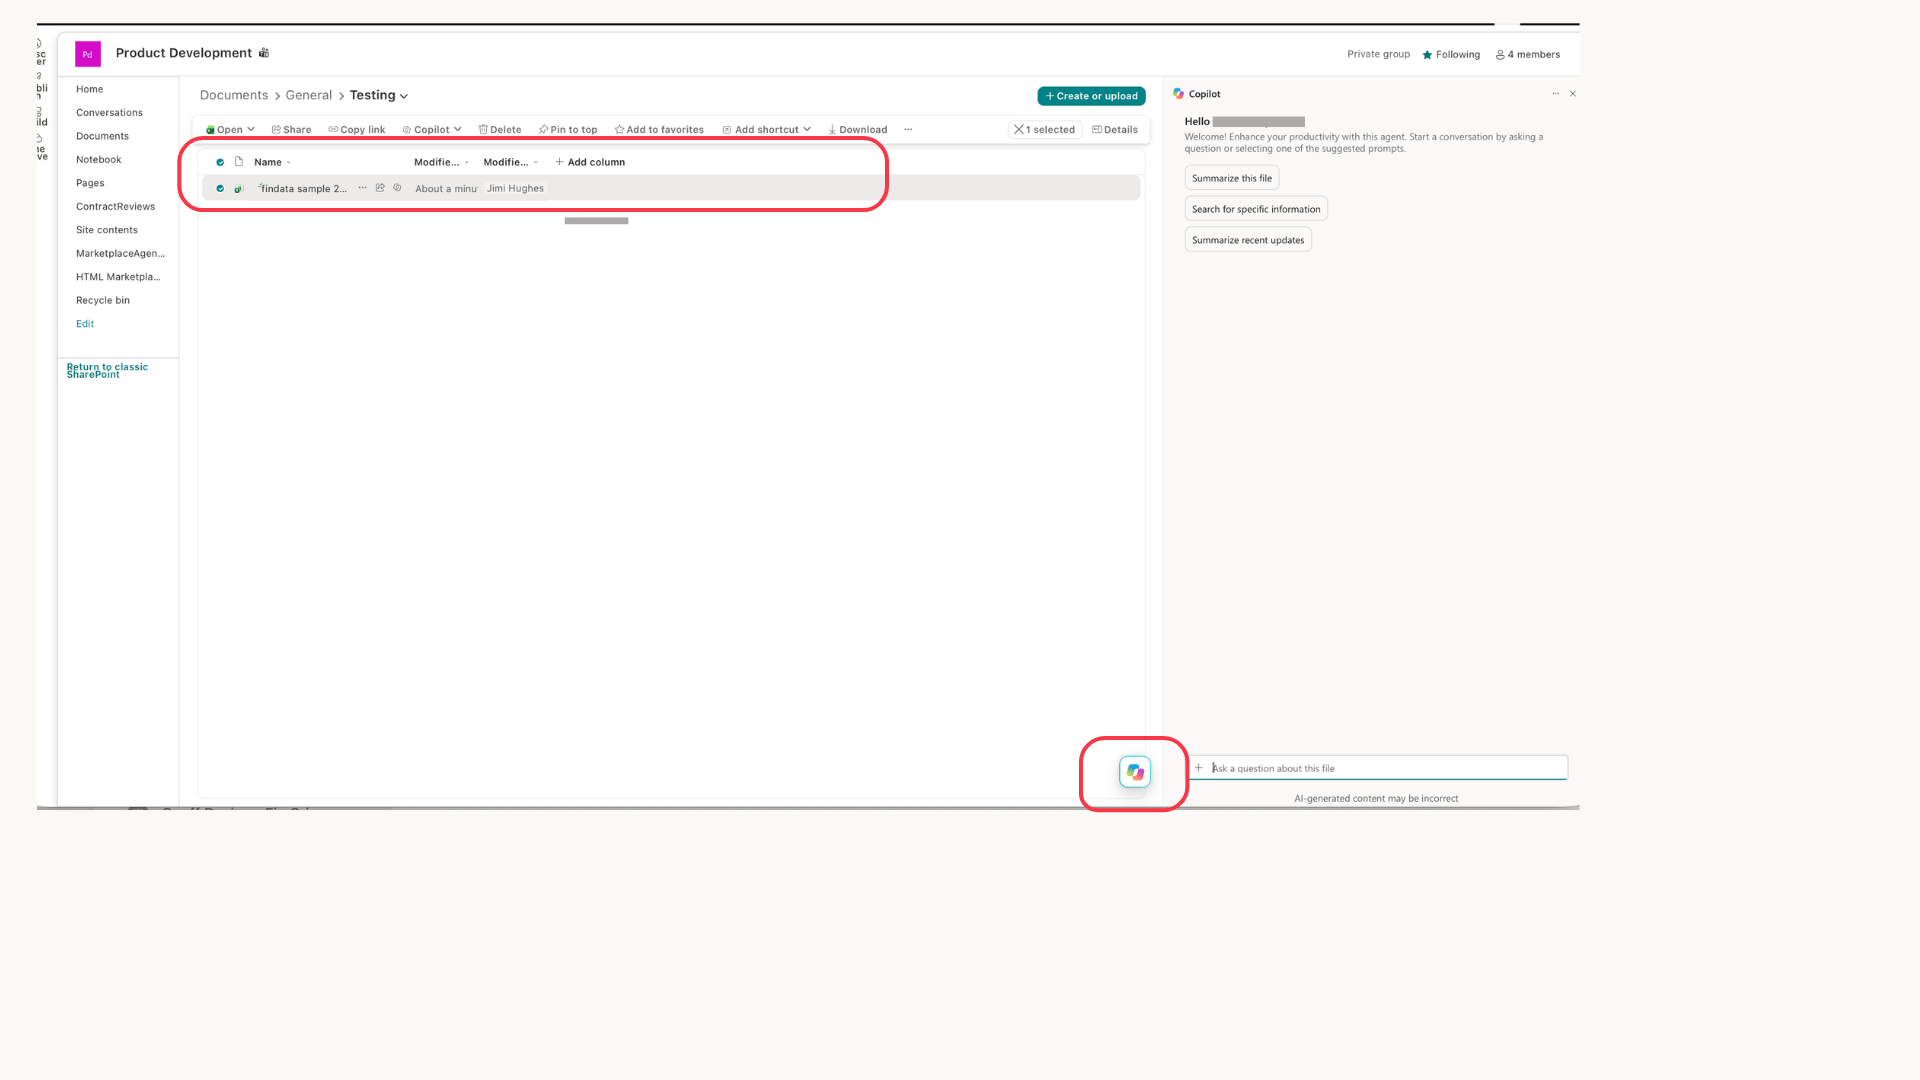
Select the workbook by clicking its row, but do not open the file. This allows Copilot in SharePoint to use the selected workbook and its actual SharePoint location as context.
Step 2: Open Copilot
With the workbook still selected, open Copilot using the button in the bottom-right corner of SharePoint, then select Open Chat. Opening Copilot from SharePoint keeps the selected workbook and its SharePoint item reference available as context for the live dashboard.
Check that the correct workbook appears as context before entering your prompt. This step must be completed through Copilot in SharePoint. Uploading a copy of the workbook to a separate Copilot conversation may create a static dashboard instead.
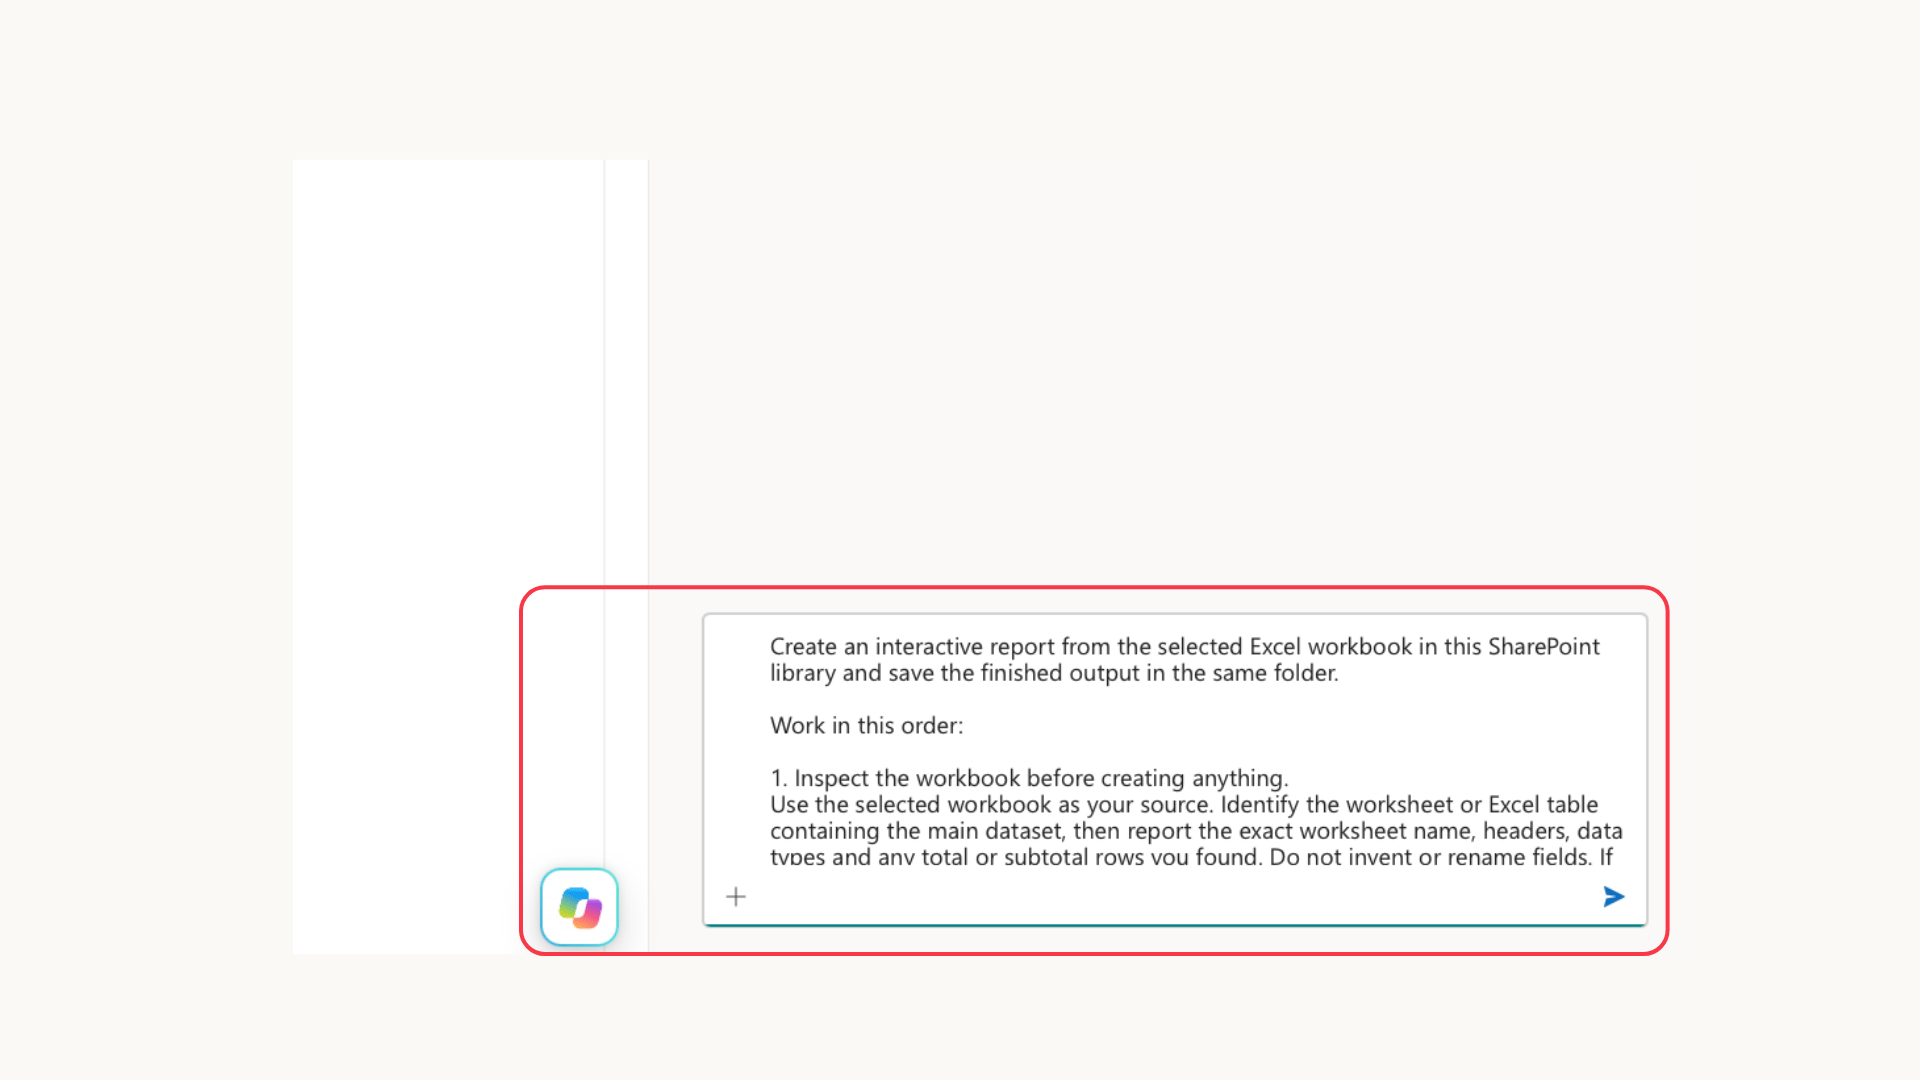
Step 3: Enter the prompt
The prompt needs to explain:
- Who will use the dashboard
- What they need to understand
- Which figures, charts and filters should be included
- That the selected SharePoint workbook must remain the source
- That Refresh must retrieve the latest saved workbook data
Use the prompt below as a starting point, replacing the audience, measures and filters with details that match your workbook.
Be specific about the questions the dashboard should answer. Asking Copilot for a generic dashboard may produce something visually impressive without necessarily making the most useful information easier to understand.
Step 4: Review the result
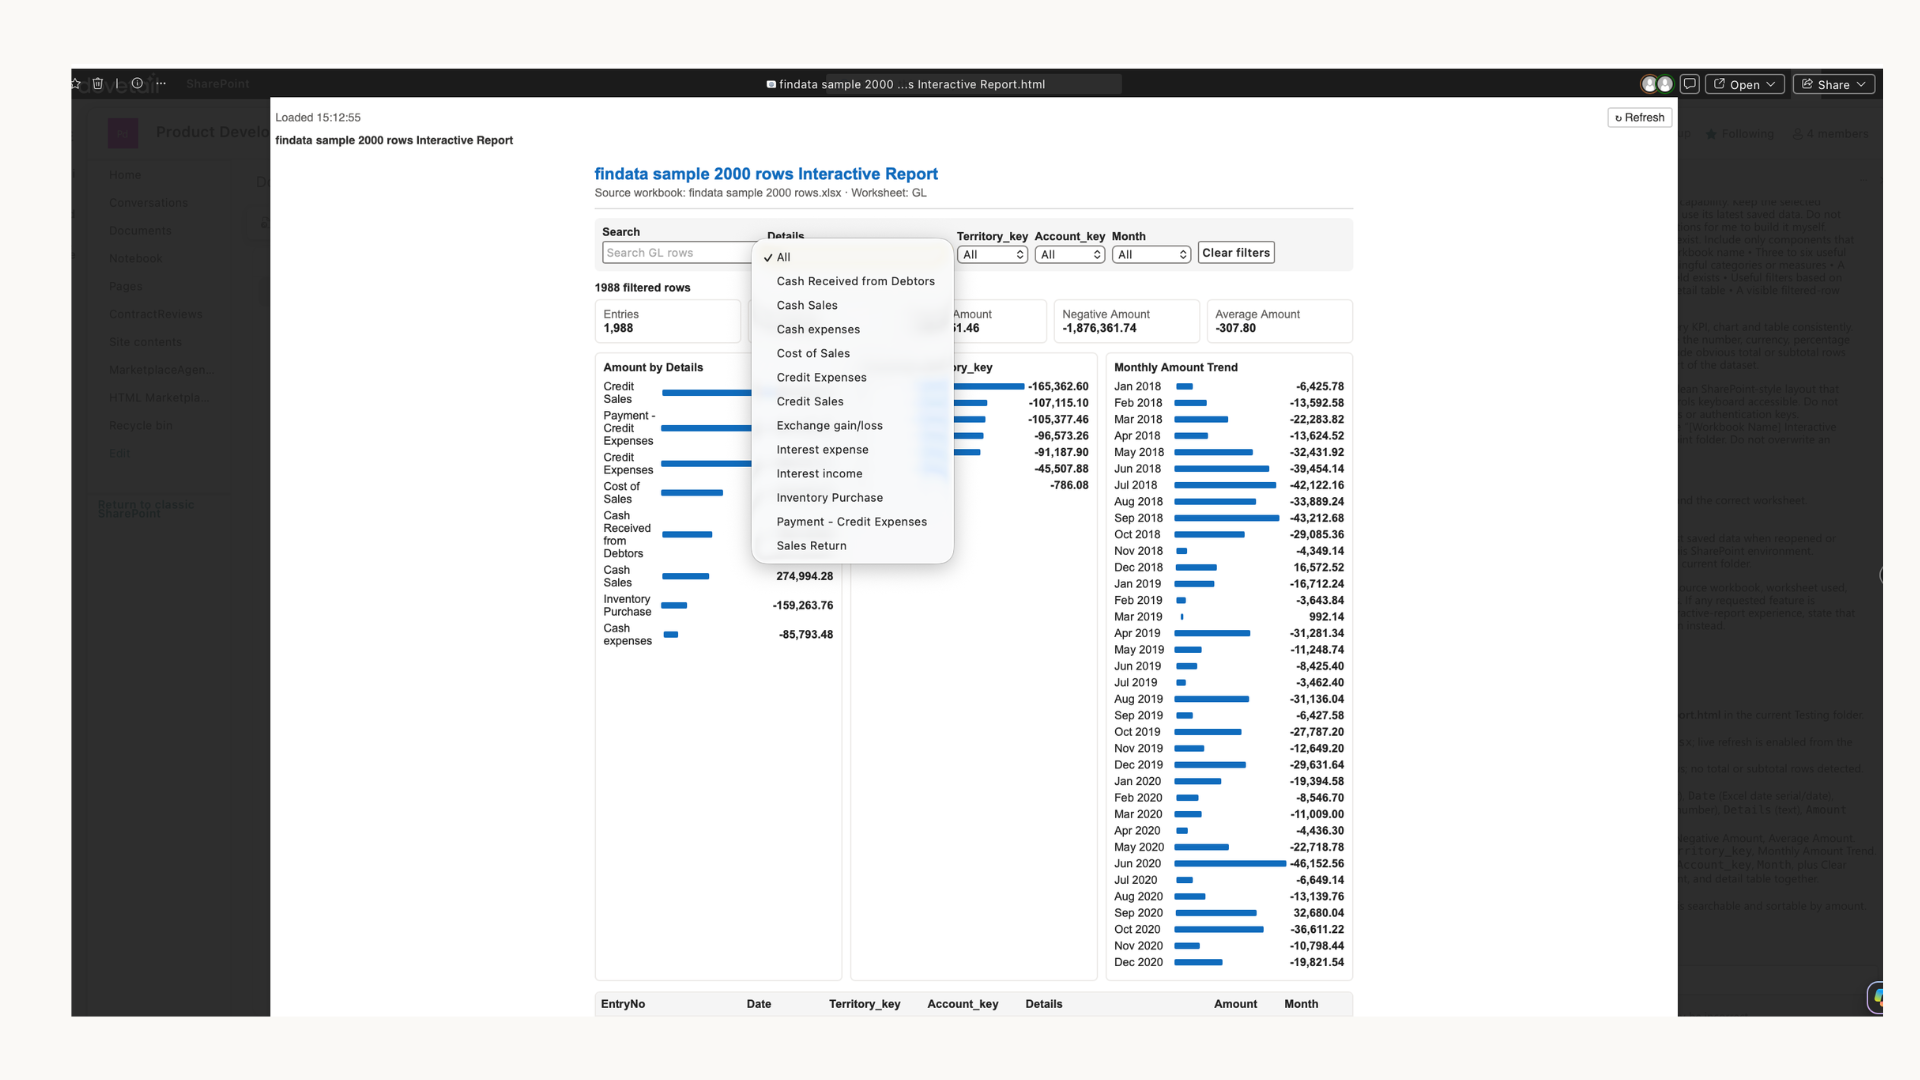
Open the HTML file Copilot creates and check that:
- It uses the correct worksheet and columns
- The headline figures match the workbook
- The charts represent the data accurately
- The filters update the entire dashboard
- The underlying table includes the expected records
- A Refresh button is available
If the layout or content is not right, return to Copilot and give it specific instructions about what needs to change. Treat the first dashboard as a draft rather than assuming every calculation and visual choice is correct.
Prove the connection is live
A Refresh button alone does not prove that the dashboard is connected to the workbook. Test the connection before sharing the result.
- Open the dashboard and make a note of one headline figure.
- Return to the same Excel workbook in SharePoint.
- Edit a distinctive value that affects that figure.
- Save and close the workbook.
- Return to the HTML dashboard.
- Select Refresh, or reload the page.
- Check that the headline figure, relevant chart and underlying table now show the updated value.
Use the same workbook throughout the test. Do not delete it and upload another file with the same name, as the replacement may have a different SharePoint item reference.
If the change appears in the headline figure, relevant chart and underlying table without the HTML file being recreated, you have confirmed that the dashboard is retrieving the latest saved workbook data rather than displaying a static copy.
If the dashboard does not update: Check that the workbook was saved, that you edited the original SharePoint file and that the prompt instructed Copilot to retrieve the workbook data rather than permanently embed the current rows.
Troubleshooting
If the dashboard doesn't behave as expected, these are the first things to check.
Before sharing the dashboard
Before sending the dashboard to colleagues or stakeholders, spend a few minutes checking the output.
Confirm that:
- Key figures match the workbook
- Charts tell the correct story
- Filters work as expected
- Sensitive information isn't exposed
- Users have the appropriate SharePoint permissions
Remember that Copilot can help create dashboards quickly, but it cannot guarantee that the calculations, assumptions or visualisations are correct. Treat the generated dashboard like any other report and validate the important numbers before relying on it.
This approach is particularly useful for project updates, management reporting, prototypes and one-off analysis. For business-critical reporting, it should complement rather than replace governed reporting platforms.
What to take away
Creating HTML dashboards from Excel is one of the most useful and accessible things you can do with Copilot. A workbook that would normally require users to scroll through worksheets and thousands of rows can become something people can filter, search and understand in minutes.
The real benefit comes when the workbook remains the source of truth. Instead of rebuilding the dashboard every time the data changes, you can update the workbook, refresh the dashboard and continue working from the latest information.
Start with a well-structured workbook, be specific about what the audience needs to understand and always test the live connection before sharing the result. You'll get a far more useful outcome than simply asking Copilot to create a dashboard.
Try it for yourself
If you're exploring how Copilot, agents and automation could improve reporting, decision-making or business processes, get in touch with us using the form below.
We have step by step guides on automations you can make using Copilot in SharePoint.